Canada’s Inflation Rate Holds at 3.1% in October 2026: What Rose and What Fell
Canada’s annual inflation rate stayed at 3.1% in October. Gas, groceries and clothing cost more, while cheaper cellphone plans and slower rent growth kept the overall rate from rising.
- Figures checked November 16, 2026
- By Krish Paul
- 10 min read
On this page
- The short answer
- Inflation over the past 12 months
- October by the numbers
- Why gas inflation rose even though pump prices fell
- Groceries are rising faster again
- Clothing posts its biggest monthly jump since 2019
- What held inflation down: phone plans and rent
- What $100 of spending a year ago costs now
- Inflation by province
- Core inflation is still close to 2%
- What it means for the December 9 rate decision
- Work out your own inflation rate
- What this means for your money
- Five things to do this month
- Frequently asked questions
Here is what changed, why gas inflation went up even though pump prices fell, how your province and city compare, and what it could mean for the Bank of Canada’s December 9 rate decision. There is also a calculator for your own inflation rate.
The short answer
The Consumer Price Index rose 3.1% in the 12 months to October 2026, matching September and coming in just under the 3.2% economists expected. Prices rose 0.2% from September. Gasoline was up 30.9% from a year earlier, groceries 2.0% and clothing 1.8%. Cellphone plans fell 6.2% and rent growth slowed to 1.7%.
According to Statistics Canada, the upward pressure was broad, coming from gas, natural gas, groceries and clothing. Take energy out, though, and inflation was 2.0%, right on the Bank of Canada’s target. That gap has defined 2026. An oil shock tied to conflict in the Middle East and Ukraine is lifting the headline number, while most other prices are rising at a normal pace.

Inflation over the past 12 months
A year ago, inflation was 2.2%. It dipped to 1.8% in February 2026, then climbed from March as the oil shock pushed up gas prices. It reached 3.2% in May and has been at 3.0% or higher every month since July.
October by the numbers
Here is how the main items moved compared with September. Red marks a faster increase than the month before, green a slower one.
| Item | September | October |
|---|---|---|
| All items | 3.1% | 3.1% |
| Gasoline | 27.8% | 30.9% |
| Energy | 19.0% | 21.8% |
| Transportation | 8.4% | 8.9% |
| Food from stores | 1.7% | 2.0% |
| Restaurant food | 3.1% | 3.1% |
| Clothing | -0.3% | 1.8% |
| Rent | 2.8% | 1.7% |
| Shelter | 1.8% | 1.4% |
| Cellular services | 0.8% | -6.2% |
| Goods | 3.7% | 4.3% |
| Services | 2.6% | 2.1% |
| All items excluding energy | 2.1% | 2.0% |
| All items excluding food and energy | 2.1% | 1.8% |
Source: Statistics Canada, Consumer Price Index, October 2026, released November 16, 2026. All figures are 12-month changes, not seasonally adjusted.
One split stands out. Goods prices rose 4.3% from a year ago, about double the 2.1% pace for services. Goods include gas, food and clothing, which react quickly to oil prices and shipping costs. Services such as rent and phone plans reflect costs here at home, and they are rising slowly.
Why gas inflation rose even though pump prices fell
Gas prices fell 2.5% from September to October. Yet the yearly increase grew from 27.8% to 30.9%. The starting point explains much of it. Statistics Canada says the faster rise partly reflects a drop in crude oil prices in October 2025, which pulled pump prices down a year ago. Measured against that lower base, this October looks more expensive, even though prices eased during the month.
The chart puts both years on the same scale. Working back from the published changes, gas prices fell about 4.8% in October 2025, nearly twice this year’s 2.5% drop.
This is called a base-year effect, and it works in both directions. It also explains the drop in cellphone plan prices further down. RBC economist Abbey Xu noted that gas prices have fallen so far in November, but said the outlook for energy is still very uncertain.
Groceries are rising faster again
Food bought in stores cost 2.0% more than a year earlier, up from 1.7% in September. It is the first speed-up after four months of slower growth. Fresh vegetables rose 1.4% after falling 2.9% in September, and condiments, spices and vinegars rose 2.6%. Restaurant prices were up 3.1%, the same as the month before.
Grocery inflation is still running below the overall rate. Over a longer stretch, though, the climb is steep. Statistics Canada says grocery prices are 31.9% higher than in October 2020, so a cart that cost $100 then costs about $131.90 now. To see that on your own groceries, try our Receipt Time Machine, which prices a receipt at past Statistics Canada prices.

Clothing posts its biggest monthly jump since 2019
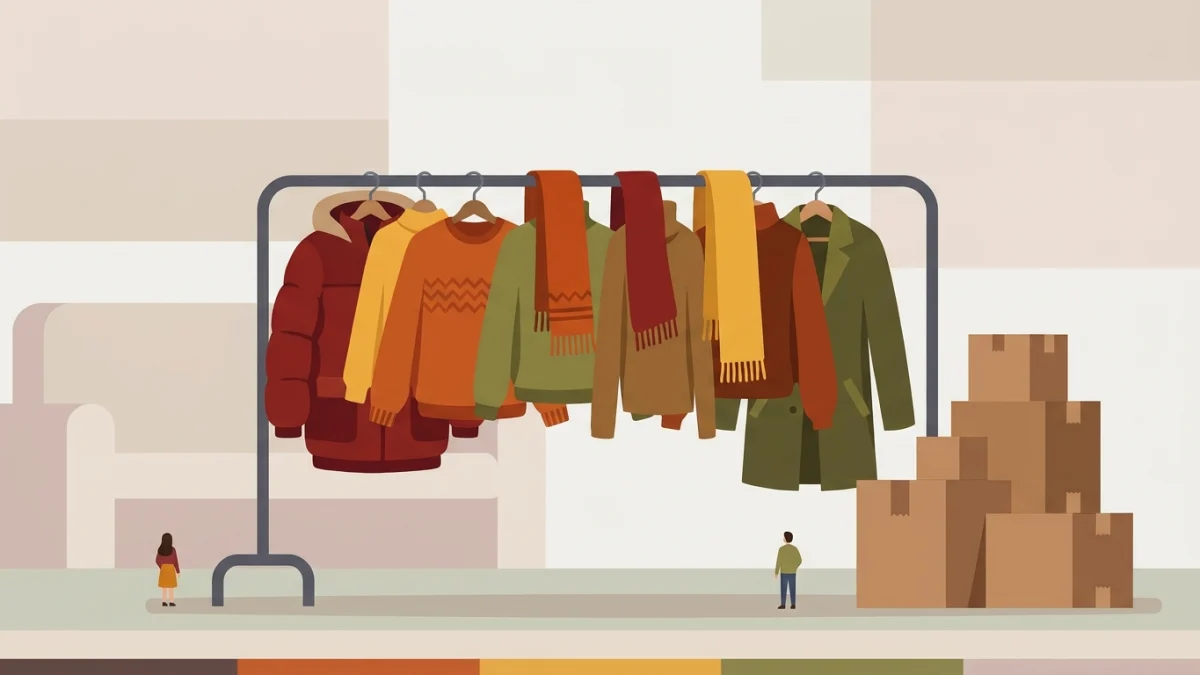
Clothing prices rose 3.4% from September to October, the largest monthly increase since September 2019. Statistics Canada linked the rise to higher shipping costs. Some of it is also the usual seasonal switch to fall and winter stock.
Compared with a year earlier, clothing was up 1.8%, after a 0.3% decline in September. Women’s clothing rose 2.2% and men’s clothing 1.4%.
What held inflation down: phone plans and rent
Cellphone plans
Prices for cellular services fell 6.2% from a year earlier, after a 0.8% rise in September. This is another base-year effect. Providers raised prices in October 2025, and that increase has now dropped out of the yearly comparison. From September to October this year, plan prices actually rose 0.6%.
Rent and shelter
Rent rose 1.7% from a year earlier, down from 2.8% in September. Statistics Canada said slower rent growth was the main reason prices rose more slowly in British Columbia. In Ontario, rent was up 1.1%. The overall shelter index, which also covers homeowner costs, utilities and property taxes, rose just 1.4%.
Property taxes, which Statistics Canada prices once a year in October, rose 3.8% nationally, down from 5.6% in October 2025. Manitoba’s increase slowed to 4.5% from 19.5% a year earlier, while Newfoundland and Labrador’s rose to 5.9% from 2.6%. Ontario’s was 3.3%.

What $100 of spending a year ago costs now
Another way to read the report: take $100 of spending in October 2025 and apply each category’s yearly change. Gas is the outlier. Most other categories cost between $101 and $104, and phone plans cost less.
Inflation by province
Prices rose more slowly in October than in September in five provinces: Prince Edward Island, New Brunswick, Manitoba, Alberta and British Columbia. Nova Scotia had the highest rate at 5.9%. Ontario and British Columbia had the lowest, both at 2.5%. All four Atlantic provinces were at 4.8% or higher.
Quebec rose to 3.4% from 3.1%, and Saskatchewan to 3.7% from 3.3%. In Ontario, natural gas prices rose 3.0% from a year earlier, after an 18.7% drop in September, another swing driven by last year’s prices.
Inflation in major cities
Statistics Canada also publishes rates for selected cities. They are based on smaller samples and can jump around from month to month.
| City | September | October |
|---|---|---|
| St. John’s, N.L. | 4.6% | 5.1% |
| Charlottetown-Summerside | 5.6% | 5.1% |
| Halifax | 5.4% | 5.8% |
| Saint John, N.B. | 4.8% | 4.7% |
| Quebec City | 3.3% | 3.5% |
| Montreal | 3.0% | 3.4% |
| Ottawa | 3.0% | 3.3% |
| Toronto | 2.1% | 2.1% |
| Thunder Bay, Ont. | 2.8% | 3.2% |
| Winnipeg | 4.2% | 4.1% |
| Regina | 3.4% | 3.6% |
| Saskatoon | 3.1% | 3.6% |
| Edmonton | 3.5% | 3.4% |
| Calgary | 3.4% | 3.1% |
| Vancouver | 3.0% | 2.5% |
| Victoria | 3.4% | 2.7% |
| Whitehorse | 6.1% | 5.0% |
| Yellowknife | 4.7% | 4.6% |
| Iqaluit | 3.0% | 3.2% |
12-month CPI change, not seasonally adjusted. Source: Statistics Canada, October 2026. Toronto held at 2.1%, the lowest of the cities listed.
Core inflation is still close to 2%
The Bank of Canada looks past volatile prices to see where inflation is heading. Its preferred measures stayed near its 2% target in October. CPI-trim held at 1.8%, CPI-median edged up to 2.0% from 1.9%, and CPI-common rose to 2.5% from 2.4%. CPI excluding food and energy slowed to 1.8% from 2.1%.
RBC’s Abbey Xu said underlying price pressure stayed fairly contained, and that unusually fast price growth is limited to a small share of the items people buy. She also warned that the longer energy prices stay high, the more those costs will work their way into other prices, with a delay.
What it means for the December 9 rate decision
On October 28, the Bank of Canada raised its policy rate by 0.25 points to 2.50%, its first increase since July 2023. It acted to stop high energy costs from spreading to other prices and said more hikes could be needed, though it would move carefully. Our breakdown of the October hike covers what changed for borrowers.
October’s report shows little sign of that spread so far. Benjamin Reitzes, a rates strategist at BMO, told The Canadian Press there is “nothing in these numbers at the moment that really screams rate hike.” He added that the Bank has sounded hawkish in recent weeks, so a December move is still possible. After the October hike, CIBC senior economist Andrew Grantham said he expected a pause on December 9 and another quarter-point increase in January.
Timing matters here. The Bank decides on December 9, and November’s inflation numbers are not due until December 14. That makes this the last CPI report the Bank will see before its decision. The job market is part of the picture too: unemployment rose to 6.7% in October, as we covered in our October jobs report.
Work out your own inflation rate
The national rate is an average. A household that drives a lot feels gas prices far more than one that takes transit. Enter your monthly spending to see your own rate and which costs are pushing it up.
Your personal inflation rate
Enter roughly what you spend in a month now. The calculator uses Statistics Canada’s October price changes to show what the same spending cost a year ago. Leave a box at 0 if it does not apply.
Rates are Statistics Canada’s 12-month changes for October 2026. “Everything else” uses the 1.8% rate for all items excluding food and energy, so it does not capture home heating or electricity. Your own prices will differ. Calculator by Gizly.
With the sample numbers, gas adds about $47 a month on just $200 of spending. Housing adds about $33 because the amount is so large, and the phone plan saves about $5.
What this means for your money

Savings
Your savings need to earn more than 3.1% just to keep their buying power. A savings account paying 2.5% loses about 0.6% a year in real terms, before tax. Check what your account pays against our high-interest savings account and GIC rate roundups, and use the GIC and savings calculator to see your return after tax and inflation.
Variable-rate mortgages and lines of credit
Prime has been 4.70% at the big banks since October 29. If the Bank holds on December 9, your rate stays put. If it raises again by 0.25 points, each $500,000 of an adjustable-rate mortgage with 25 years left costs about $70 more a month. Run your own numbers in our mortgage payment calculator, and see how the rate hike hits everyday Canadians for rent, savings and jobs.
Everyday costs
Gas is the cost to watch. It drives most of the gap between the 3.1% headline and the 2.0% rate without energy. Phone plans are cheaper than a year ago, so if you have not looked at your plan since last fall, compare it with what your carrier offers new customers. In Ontario, homeowners saw property taxes rise 3.3%.
Five things to do this month
- Find your own rateUse the calculator above. If gas is your biggest driver, your rate may be well above 3.1%.
- Check your savings rateAnything under 3.1% is losing buying power. Moving idle cash can close the gap.
- Review your phone planPlan prices are 6.2% lower than a year ago. Ask your carrier to match current offers.
- Plan for December 9If you have a variable rate, budget for a possible 0.25-point increase so it does not catch you short.
- Watch December 14November’s inflation report will show whether gas prices kept easing.
Frequently asked questions
What is Canada’s inflation rate for October 2026?
Statistics Canada says the Consumer Price Index rose 3.1% in the 12 months to October 2026, the same as in September. Prices rose 0.2% from September to October. Excluding energy, inflation was 2.0%.
Why did gas inflation go up if gas prices fell in October?
Gasoline prices fell 2.5% from September to October 2026, but they also fell sharply in October 2025 when crude oil dropped. Compared with that lower starting point, the 12-month increase grew from 27.8% in September to 30.9% in October. This is called a base-year effect.
Which province has the highest inflation right now?
In October 2026, Nova Scotia had the highest annual inflation rate at 5.9%, followed by Prince Edward Island at 5.2%. Ontario and British Columbia had the lowest, both at 2.5%.
What is core inflation in Canada now?
The Bank of Canada’s preferred core measures in October 2026 were CPI-trim at 1.8%, CPI-median at 2.0% and CPI-common at 2.5%. CPI excluding food and energy rose 1.8%.
Will the Bank of Canada raise interest rates in December 2026?
No one knows yet. The Bank raised its policy rate to 2.50% on October 28 and said more increases could be needed. Its next decision is December 9. Economists said October’s steady inflation and low core readings do not make a strong case for an immediate hike, but the Bank has not ruled one out.
When is the next CPI release in Canada?
Statistics Canada will release the Consumer Price Index for November 2026 on Monday, December 14, 2026, five days after the Bank of Canada’s December 9 rate decision.
Important: This article is general information, not financial advice. Statistics Canada’s figures can be revised, and city rates are based on small samples. Calculator results are estimates based on national price changes. See our affiliate disclosure.
Keep reading

Compare before you switch
Rates and offers checked against each bank’s own page.
Send it to a friend, a family member or a coworker with the same question. It takes one tap.
How this page was made: Gizly uses AI tools to help research and draft its guides. Krish Paul, the editor, is responsible for what Gizly publishes. Spot an error? Tell us and we will fix it.